Project Description:
Zomato is a restaurant aggregation and meal delivery service based in India. It is currently operating in several countries across the world. Zomato provides thorough information about numerous eateries as well as consumer reviews. Zomato’s owners aim to find hidden irregularities in their company’s data. The ultimate goal of this project is to examine the data in such a way that they can accurately assess their business performance.
Objective:
The clients want to construct a consolidated and interactive Power BI report that will allow them to do the following:
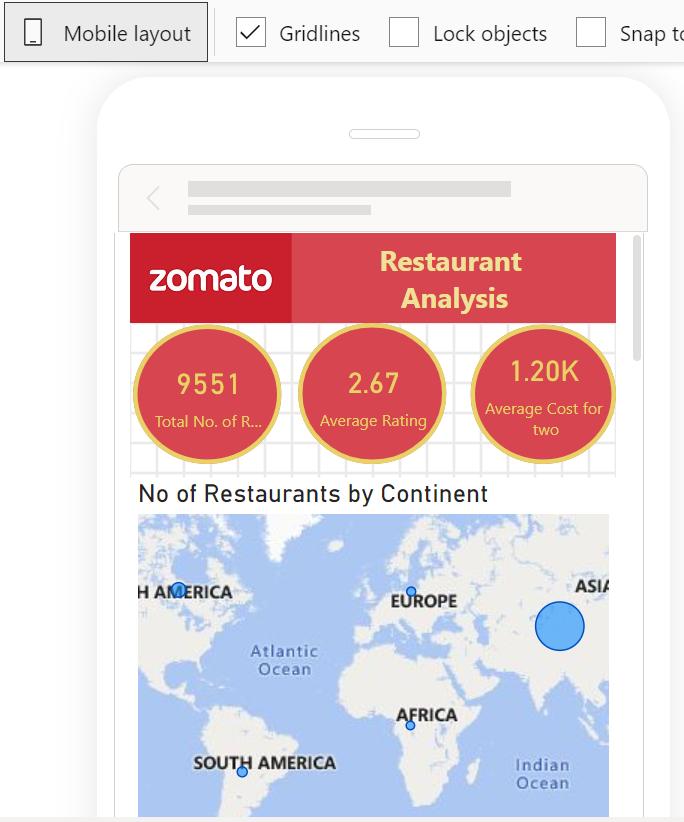
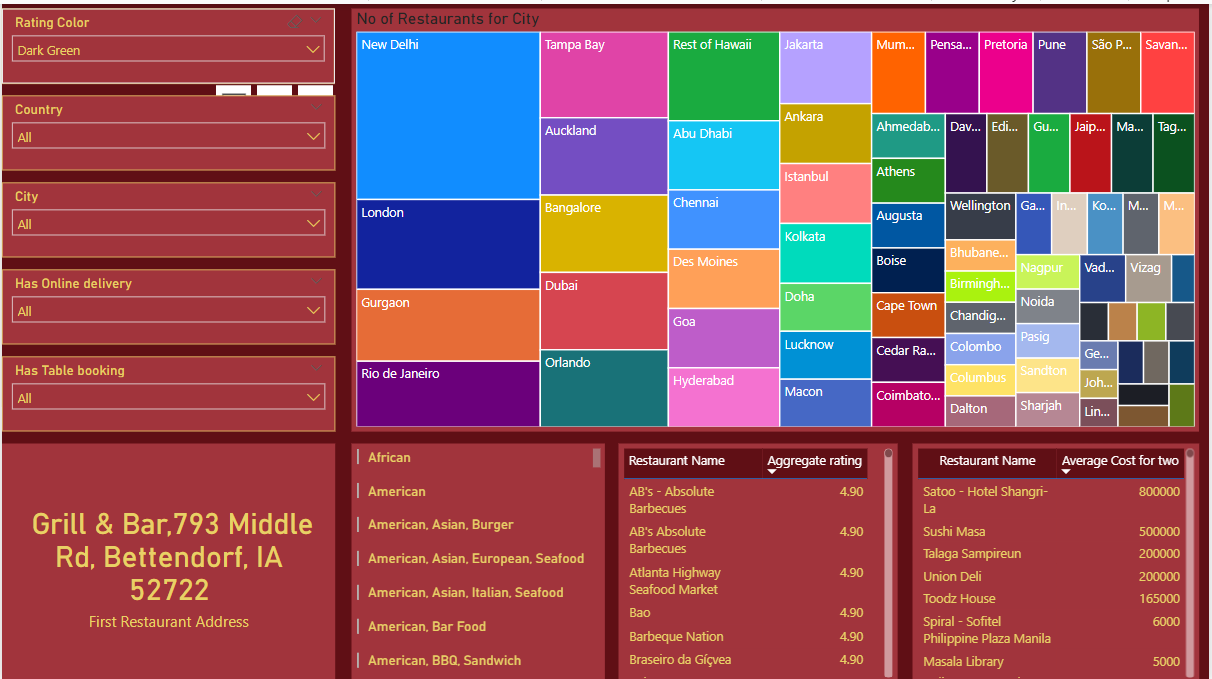
- Derive data on the total number of restaurants worldwide, including continents, countries, and cities
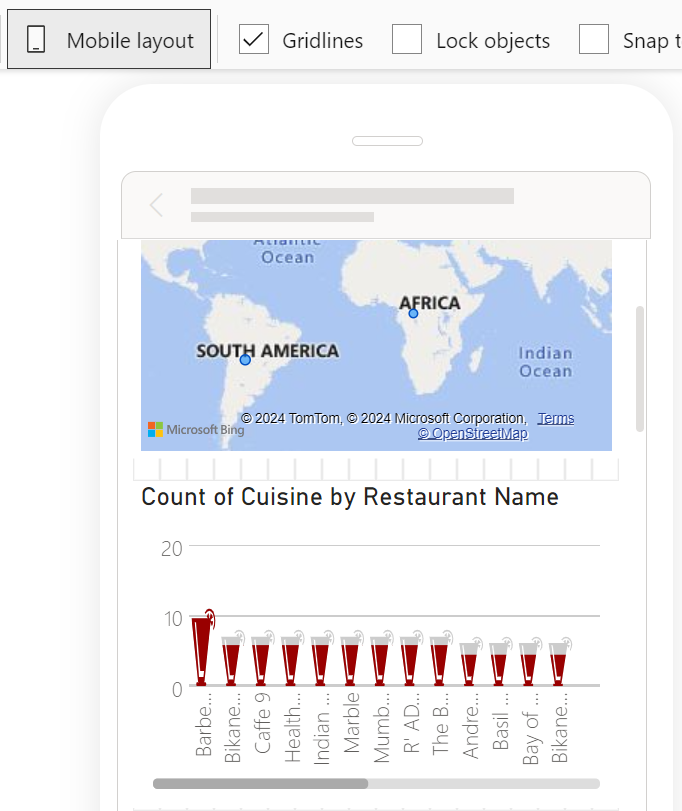
- View data on a global scale with the capacity to drill down to a granular level
- Derive data on the restaurants with the highest average customer ratings
- Discover the restaurants with the lowest average costs
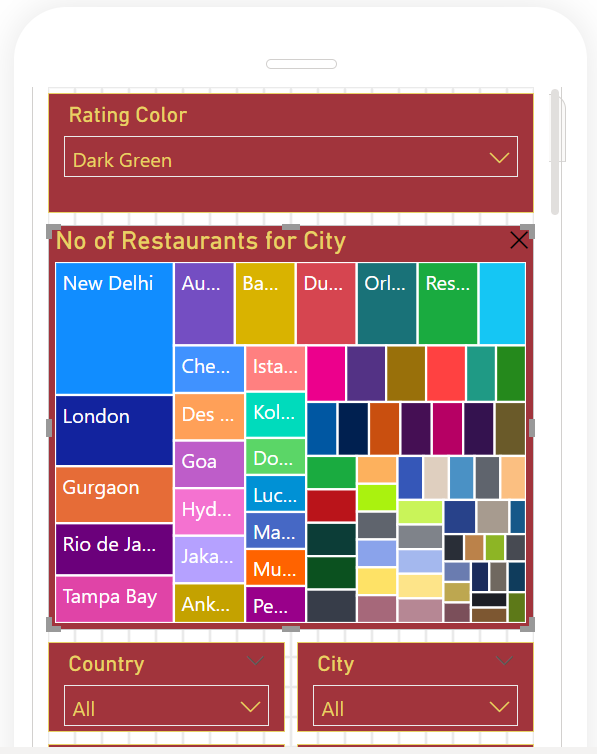
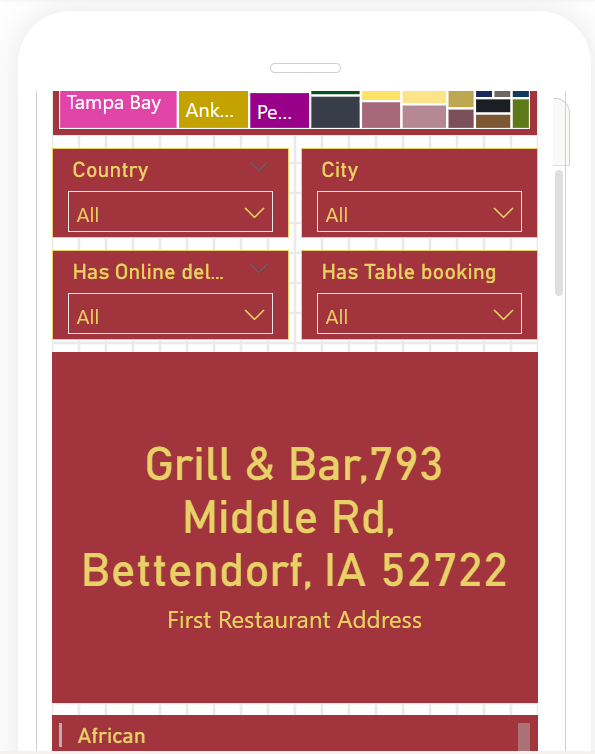
- Filter and view information on the restaurants based on:
- Their geographical dimensions such as continent, country, and city.
- The service they provide, such as online ordering or reservation services
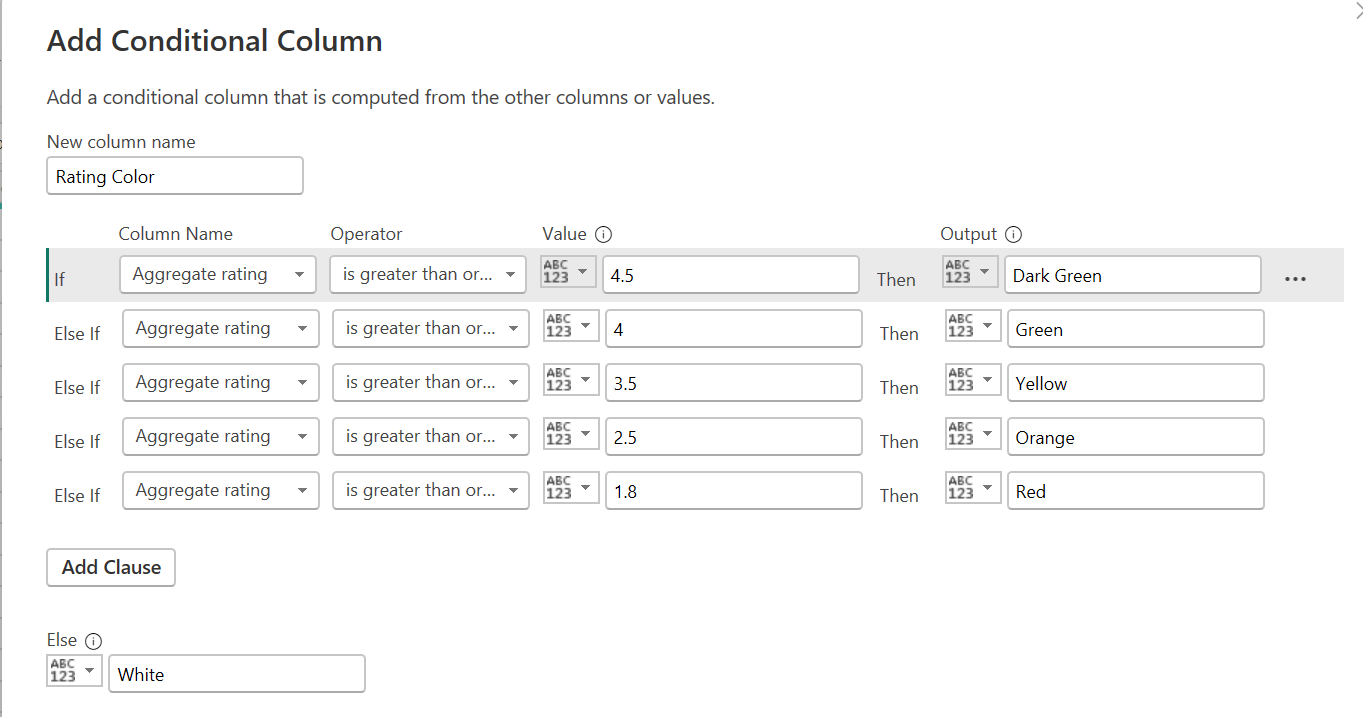
- The average rating slab by the color.
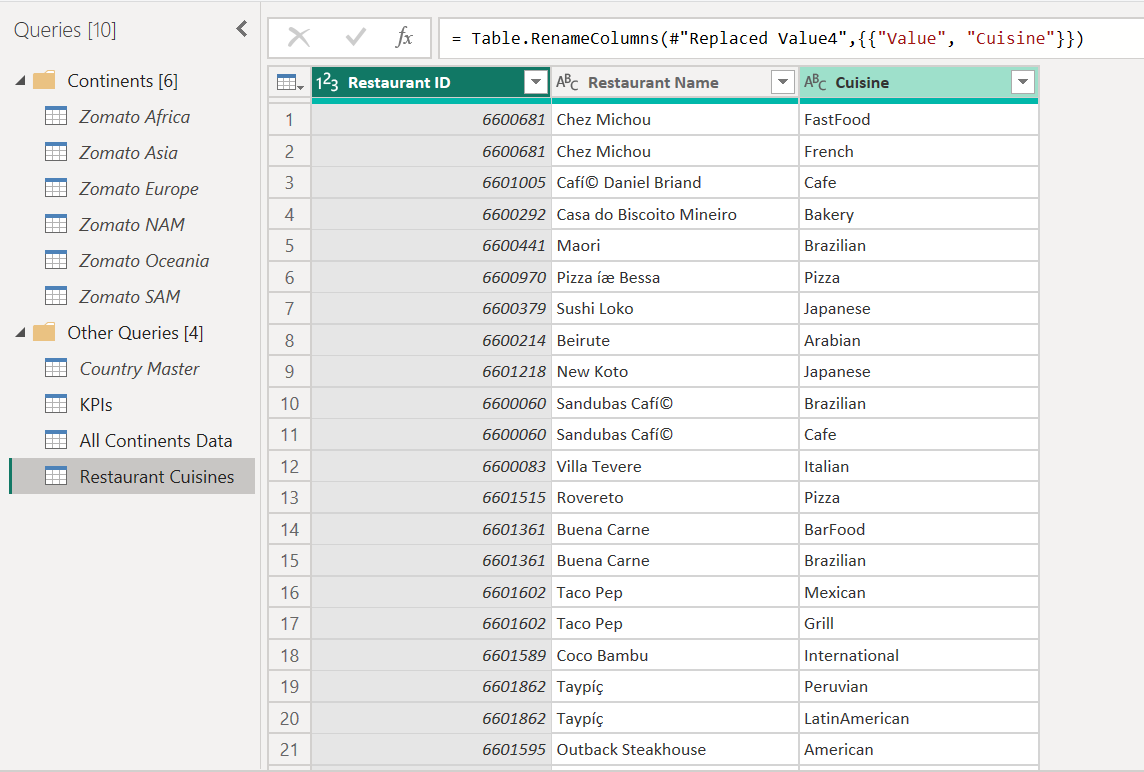
- Identify the restaurants with the most cuisines served.
Project Report:
Steps Already Performed before Visualization:
- Data Import
- Data Cleanup
- Data Tranformation
- Appending Data Tables
- Creating New Tables and Creating necessary Joins
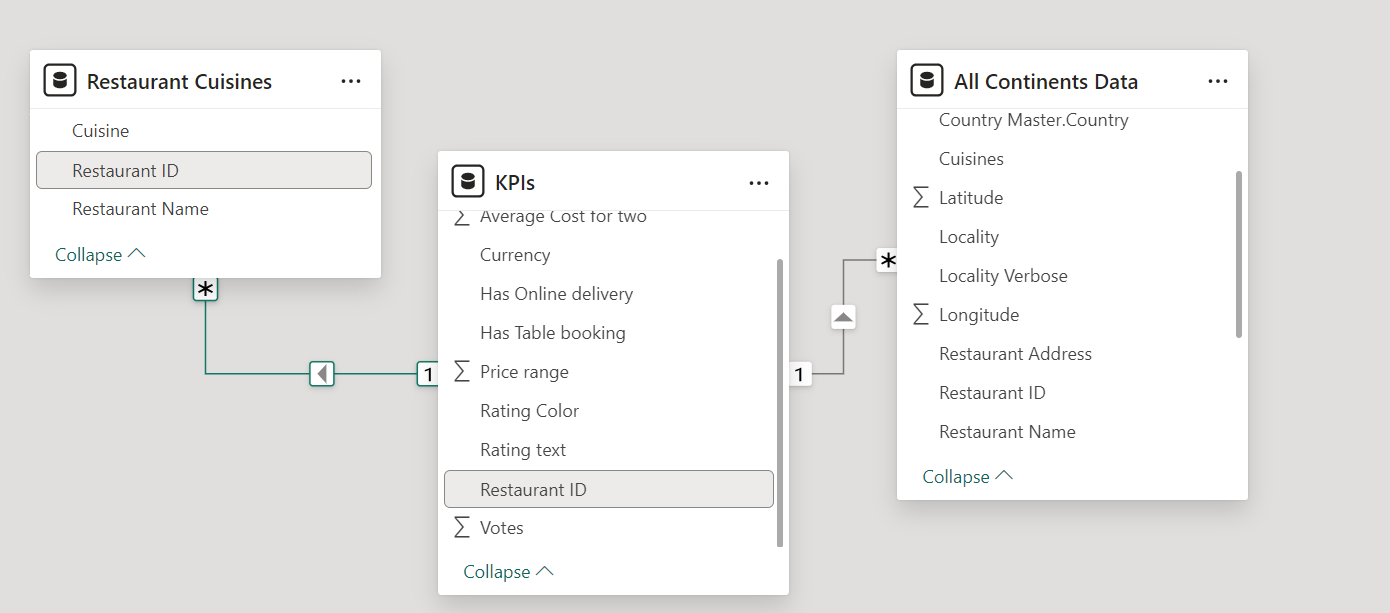
Data Modeling
While creating relationships, choose the appropriate “Cardinality” and the “Cross filter direction” so that the aggregations can happen accurately at the report level.
Use the following DAX in the project:
Data Visualization

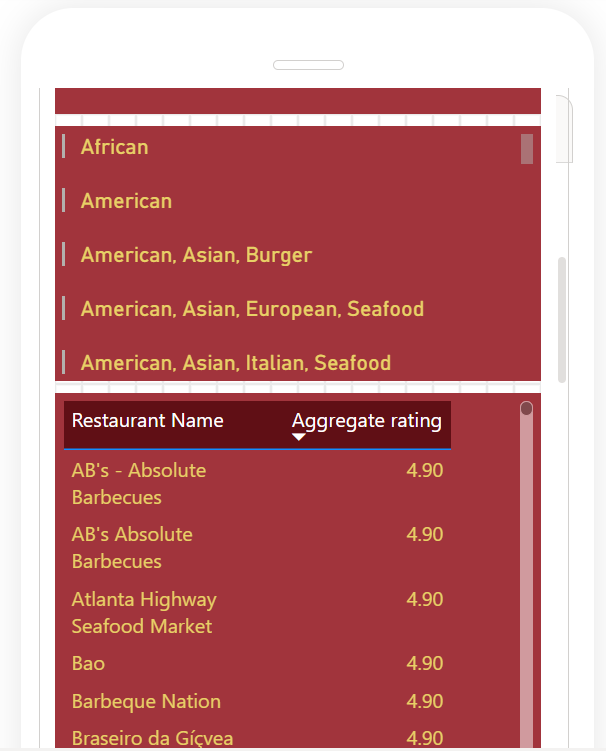
Mobile View